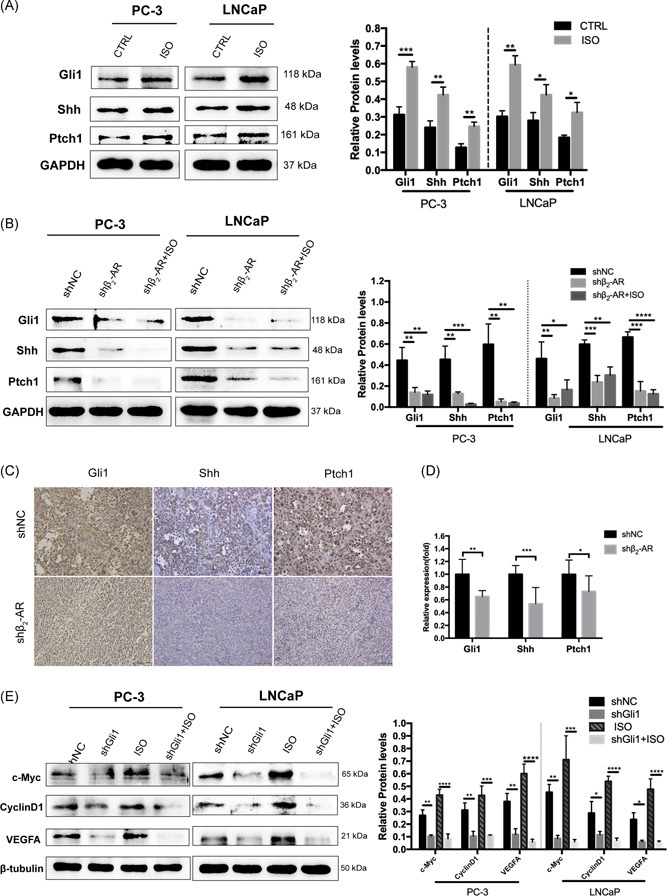
Figure 6.

Stimulation of β2‐AR signaling promotes, whereas knockdown of β2‐AR suppresses, Shh‐Gli1 signaling activity in vivo and in vitro. A, Gli1, Shh and Ptch1 expression levels were detected by Western blotting and quantification of PC‐3 and LNCaP cells treated with DMSO or 1 μM ISO for 24 hours. B, Gli1, Shh, and Ptch1 expression levels were detected by Western blotting and quantification in PC‐3 and LNCaP cells transduced with a negative control shRNA (shNC) and shRNA targeting β2‐AR (shβ2‐AR) treated with DMSO or 1 μM ISO for 24 hours. C and D, Representative immunohistochemistry images and quantification of Gli1, Shh, and Ptch1 expression levels in xenografts. Scale bar, 100 μm. E, Western blotting assay of the expression of downstream genes of Shh signaling and quantification in PC‐3 and LNCaP cells stably expressing shNC or shGli1 following treatment with DMSO or 1 μM ISO for 24 hours. β2‐AR, β2‐adrenergic receptor; DMSO, dimethyl sulfoxide; ISO, isoproterenol; Ptch1, patched1; SD, standard deviation; shRNA, small hairpin RNA [Color figure can be viewed at wileyonlinelibrary.com]
