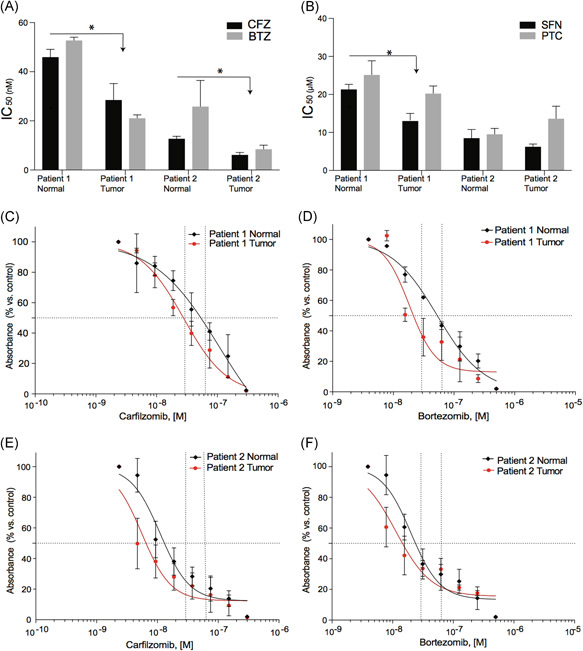
Figure 2.

Comparison of IC50 for both patient's tumor and normal CR cells exposed to drugs ranked by DrugGenEx‐Net. IC50 calculations performed on the CR cells exposed to (A) CFZ and BTZ or (B) SFN or PTC for 72 hour. 32 : molar. (C and D) Detailed dose‐response curves of the CR cells from patient 1 treated with CFZ or BTZ, respectively. (E and F) Detailed dose‐response curves of the CR cells from patient 2 treated with CFZ or BTZ, respectively All values are the average ± SD of three separate experiments performed in triplicate. BTZ, bortezomib; CFZ, carfilzomib; CR, conditionally reprogrammed; PTC, phenethyl isothiocyanate; SFN, sulforaphane [Color figure can be viewed at wileyonlinelibrary.com]
