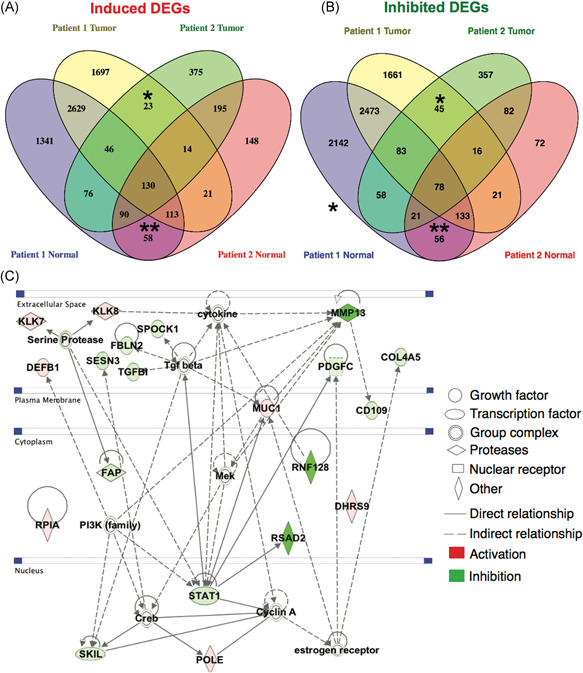
Figure 5.

Genes exclusively regulated by CFZ in normal and tumor CR cells. A, Venn diagram of the sets of genes induced (FC 1.5; FDR 0.05) by CFZ in the CR cells from patients 1 and 2. *Induced genes shared between the tumor‐derived cells. **Induced genes shared between the normal cells. B, Venn diagram of the sets of inhibited genes (FC 1.5; FDR 0.05) by CFZ in the CR cells from patients 1 and 2. *Inhibited genes shared between the tumor‐derived cells. **Inhibited genes shared between the = normal cells (C) Ingenuity Pathway Network analyses of the genes that were regulated by CFZ exclusively in the tumor‐derived CR cells. CFZ, carfilzomib; CR, conditionally reprogrammed; FC, fold change; FDR, False Discovery Rate [Color figure can be viewed at wileyonlinelibrary.com]
