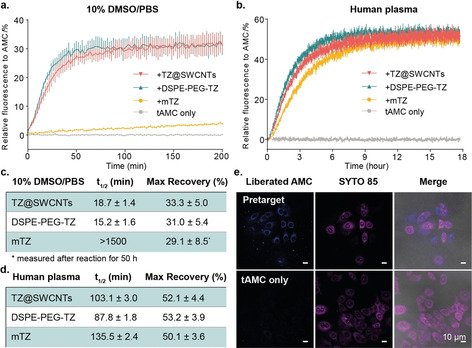
Figure 2.

Tetrazine‐responsive tAMC release. a,b) tAMC fluorescence recovery in response to TZ@SWCNTs, DSPE‐PEG‐TZ, or mTZ in 10 % DMSO in PBS (a) and pure human plasma (b) measured by following the appearance of the fluorescence signal of AMC (λ ex=380 nm, λ em=445 nm). The data represent the mean ± STD (n=3). c,d) Calculated half‐time of the tetrazine‐responsive tAMC decaging reaction and maximum fluorescence recovery in 10 % DMSO in PBS (c) and pure human plasma (d). e) Fluorescence imaging study of the pretargeted tAMC fluorescence activation in MCF‐7 cells. The nuclei were stained with SYTO™ 85 orange; scale bar 10 μm.
