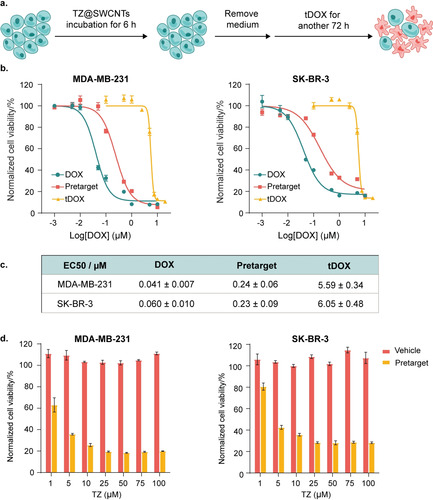
Figure 3.

Pretargeted doxorubicin delivery in vitro. a) Flowchart depicting TZ@SWCNTs pretargeting and subsequent tDOX treatment. b) Cytotoxicity of DOX, prodrug tDOX, and pretargeted strategy on MDA‐MB‐231 and SK‐BR‐3 breast cancer cells (n=3; error bars represent the STD). Blue and yellow lines indicate cells treated with DOX or tDOX of different concentrations for 72 h. For orange lines, cells were pretreated with TZ@SWCNTs (20 μm) for 6 h before replacing the media to complete medium with various concentration of tDOX for another 72 h. c) Calculated EC50 (half‐maximal effective concentration) values for DOX, prodrug tDOX, and pretargeted strategy against MDA‐MB‐231 and SK‐BR‐3 breast cancer cells. d) Cytotoxicity of the vehicle (TZ@SWCNTs, black bar) and pretargeted strategy (grey bar) on MDA‐MB‐231 and SK‐BR‐3 breast cancer cells (n=3; error bars represent the STD).
