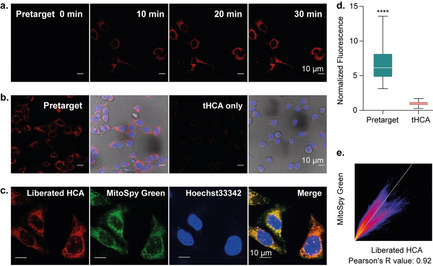
Figure 5.

Pretargeted NIR fluorogenic imaging and intracellular colocalization with mitochondria in live cells. a) Real‐time NIR fluorescence imaging in MCF‐7 cells. MCF‐7 cells were pretreated with 50 μm TZ@SWCNTs for 6 h, stained with Hoechst 33342 before adding 1 μm tHCA in PBS for real‐time fluorescence imaging; scale bar=10 μm. b) Comparison of tHCA alone and pretargeted fluorescence imaging at 35 min post tHCA addition. c) Confocal fluorescence images showing the intracellular localization of liberated HCA (red) and the overlap with MitoSpy™ (green); scale bar=10 μm. d) Fluorescence intensity quantification by measuring over 50 cells and represented as box plots. Statistics were calculated with an unpaired t test; ****P<0.0001. e) 2D intensity histogram output of spatial correlation analysis performed with Fiji ImageJ. The Pearson coefficient was calculated to be 0.92.
