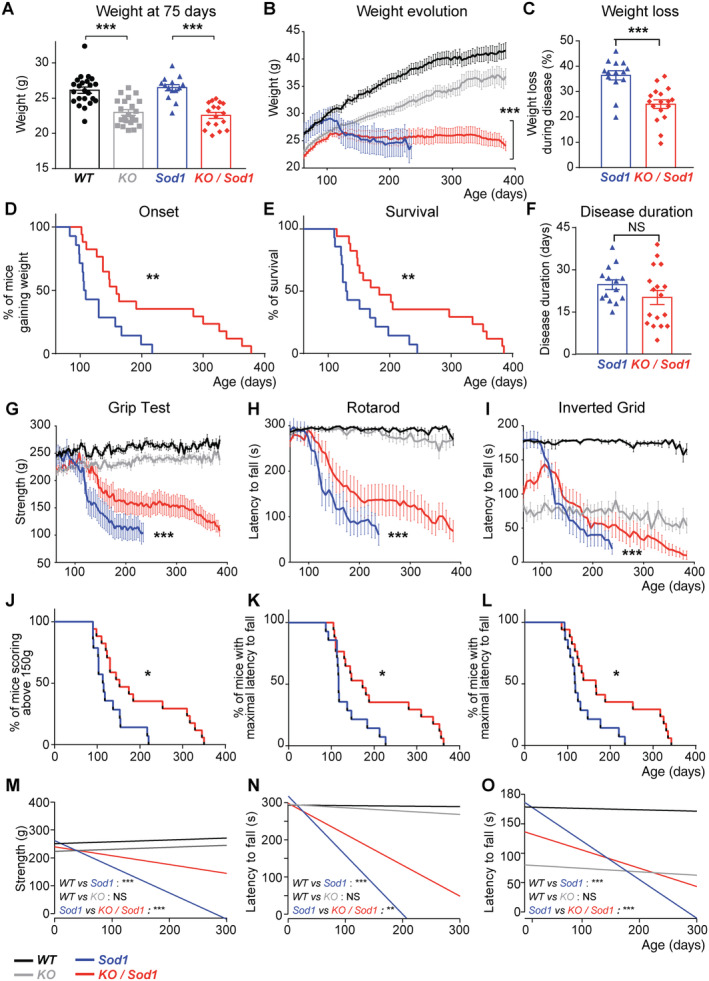
FIGURE 2.

Absence of subcerebral projection neurons (SubCerPN) delays onset, prevents weight loss, prolongs survival, and slows the decline of motor capacities. (A) Bar graph representing the average weight of the four groups of mice at the beginning of the survival study (75 days); 1‐way ANOVA. (B) Graphical representation of the evolution of the weight over time for the four genotypes. Note that although Sod1 mice clearly lost weight, KO/Sod1 mice instead stopped gaining weight; linear mixed effects model. (C) Bar graph representing the percentage of weight lost throughout the course of the disease; Student unpaired t test. (D, E) Kaplan–Meier plots of disease onset, defined as the time when animals stopped gaining weight (D), and survival (E) in days, for Sod1 and KO/Sod1 mice; log‐rank test (Mantel–Cox). (F) Bar graph representing disease duration in days; Student unpaired t test. (G–I) Graphical representation of motor capacities over time, in days, on the grip strength test (G), the rotarod test (H), and the inverted grid test (I); linear mixed effects model. (J–L) Kaplan–Meier plots of grip strength score >150g (J) and maximal latency to fall from the rotarod (K) or from the inverted grid (L); log‐rank test (Mantel–Cox). (M–O) Linear regression analysis conducted using the weight as covariate; the comparisons represented here are those of the slopes. For all data, n = 23 WT, n = 22 KO, n = 14 Sod1, and n = 17 KO/Sod1; *p < 0.05, **p < 0.01, ***p < 0.001; NS, nonsignificant.
