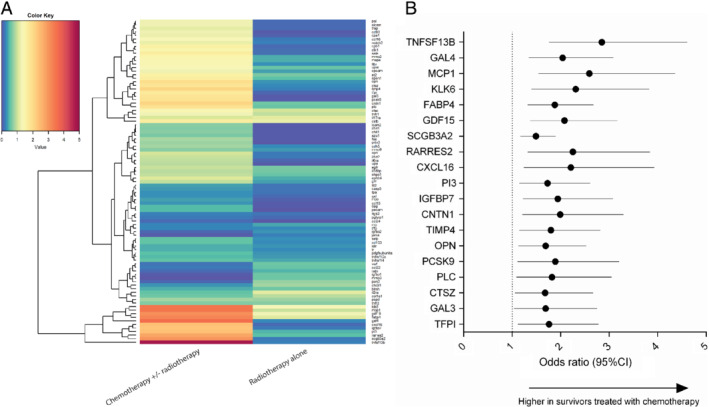
Figure 1.

(A) Heatmap depicting ‐log10 (P‐value) of biomarker associations with the chemotherapy/radiotherapy and radiotherapy group vs. age‐ and sex‐matched controls. Red signifies P < 0.05 while blue signifies P > 0.05. (B) Forest plot depicting multivariable odds ratios for biomarker levels in survivors treated with chemotherapy ± radiotherapy vs. controls. CI, confidence interval.
