
Figure 3.
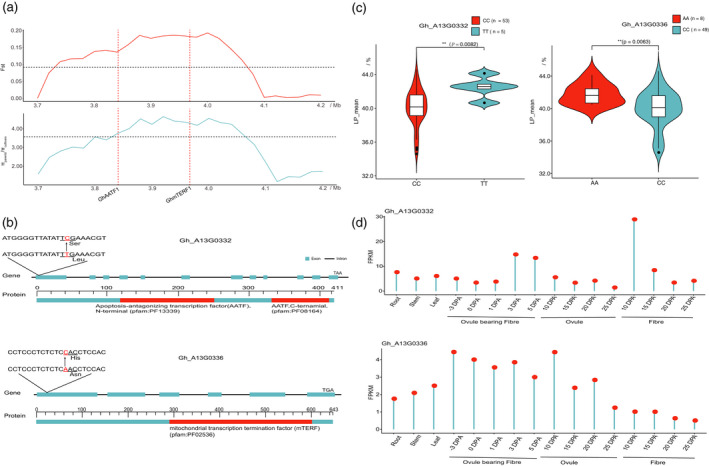
Identification of candidate genes related to trait development under artificial selection. (a) Selection signals from 3.7 to 4.2 Mb on chromosome A13. The upper line plot shows Fst in red, and the lower line plot shows πparents/πcultivars in blue. (b) Gene structure and polymorphisms of GhAATF1 and GhmTERF1. (c) Lint percentage (%) analyses of accessions with CC and TT genotypes of GhAATF1 (left). Lint percentage (%) analyses of accessions with AA and CC genotypes of GhmTERF1 (right). Centre line, median; box limits, upper and lower quartiles; and whiskers, 1.5x the interquartile range (**P < 0.01, two‐sided t‐test). (d) Transcriptomic patterns of GhAATF1 (upper) and GhmTERF1 (lower) in distinct tissues, based on the number of fragments per kilobase of the exon model per million mapped reads (FPKM) in a single experiment, including root, stem and leaf tissues during ovule and fibre development stages.