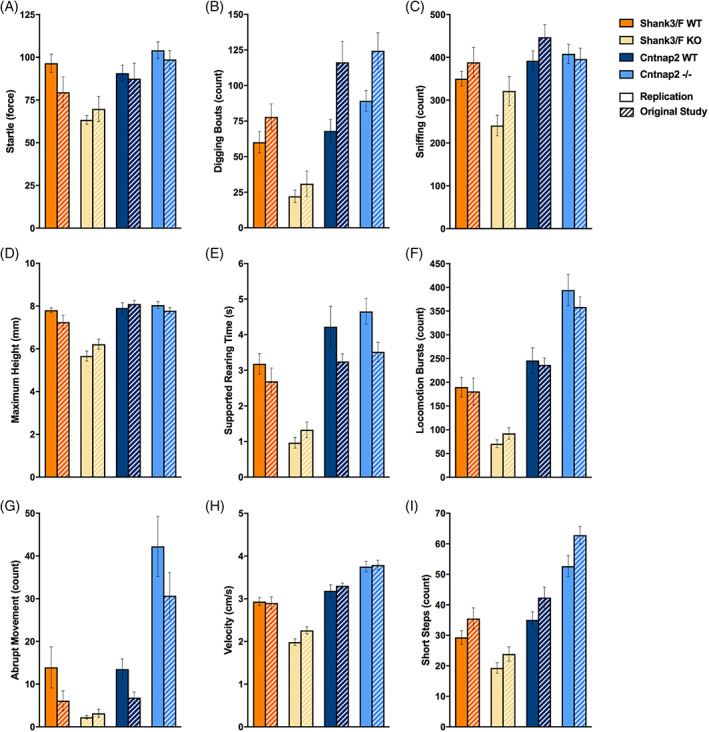
FIGURE 3.

Top features in SmartCube showed changes in opposite directions for the models across both studies. The top features that separate the mutant and control groups (see Methods) are plotted for both models and for the replication (filled bars) and original (hashed bars) study. Remarkably, even with more than a year between the original and replication study, most of the results were extremely similar. Across models, many features showed decreases in the Shank3/F knockout (KO) mice compared with corresponding wild type (WT) mice, and increases or no effect in the Cntnap2−/− mice compared with WT littermates. These measures were either obtained from pressure sensors or extracted from the videos and scored using machine learning algorithms trained on human‐labeled videos or hardcoded rules. Shank3/F KO mice showed (or tended to show) decreased startle to a tactile stimulus (A), number of digging bouts in the bedding provided (B), number of sniffing events (C), maximum height of the rump detected during the session (D), time spent rearing against the walls of the apparatus (E), bursts of locomotion (F), number of abrupt movements (G), average velocity (H) and number of short steps (I) compared with WT littermates, whereas the Cntnap2−/− model showed no change or increases in measures compared with WT littermates
