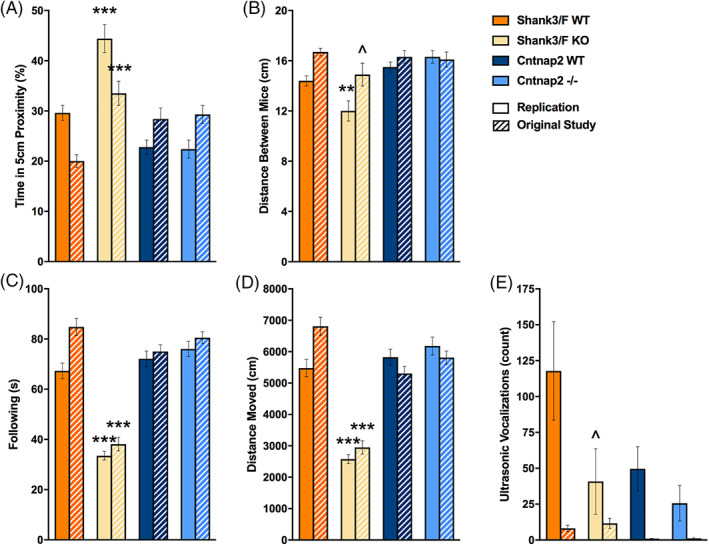
FIGURE 7.

Proximity, activity and vocalizations emitted during reciprocal social interaction. Measures are shown for the replication and original (hashed bars) study. (A) Shank3/F knockout (KO) pairs spent more time in close proximity to each other than the corresponding wild type (WT) pairs in both the original and replication study, whereas no phenotypic differences were seen in the Cntnap2 model across both studies. (B) Shank3/F KO pairs were in closer proximity to each other than the corresponding WT pairs in the replication study, whereas the difference was only marginal in the original study. There were no differences in the Cntnap2 model across both studies. (C) The time following each other was decreased in the Shank3/F KO as compared with the WT mice across both studies. The Cntnap2 model did not show a phenotypic difference in either study for this measure. (D) Distance moved showed a very similar pattern to following. (E) Shank3/F KO mice tended to emit fewer vocalizations than WT littermates in the replication but not in the original study, whereas no significant differences were observed in the Cntnap2 model in either study. Data shown are means ± SEM; n = 16 mice per genotype/line (replication), n = 14–16 mice per genotype/line (original study); compared with WT: ^p < 0.08, **p < 0.01, ***p < 0.001
