Figure 2.

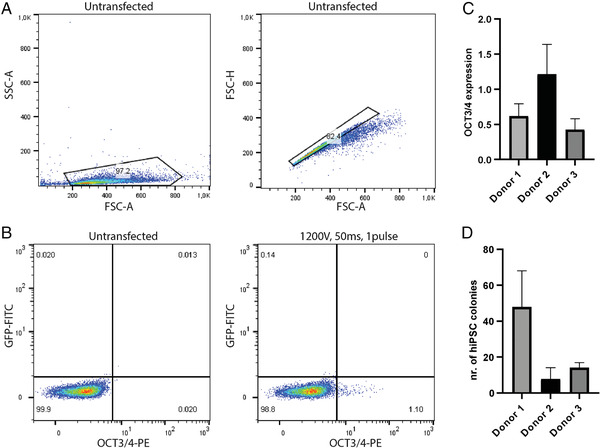
ReproRNA‐OKSGM reprogramming of UDCs. (A) Flow cytometry gating strategy for live and single cells, respectively to check transfection efficiency. (B) Example of transfection efficiency measured by flow cytometry for donor 1. (C) OCT3/4 expression measured by flow cytometry for three different donors, 72 hr after transfection (±SD). (D) Number of hiPSC colonies at 21 days after transfection for three different donors (±SD) (Donor 1: n = 7, donor 2: n = 3, donor 3: n = 2).
