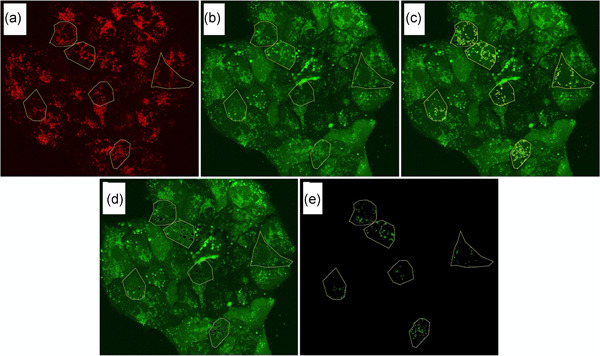
Figure 1.

The methodology of FIJI analysis: Fluorescent images were taken of live cells simultaneously treated with Lysotracker Red, pHrodogreen and sunitinib to image pH‐differences and drug uptake. Here we provide guiding images to clarify our analytical method. Images of the Lysotracker Red and pHrodoGreen channel are shown. Yellow markings represent the regions of interest. (a) Lysotracker Red with yellow markings depicting six selected cells for analysis; (b) pHrodoGreen image with yellow markings for six selected cells; (c) pHrodoGreen with markings for six selected cells with markings for lysosomes; (d) pHrodoGreen image with six selected cells with deleted lysosomal intensity; (e) pHrodoGreen image of lysosomes of the six selected cells
