Figure 2.

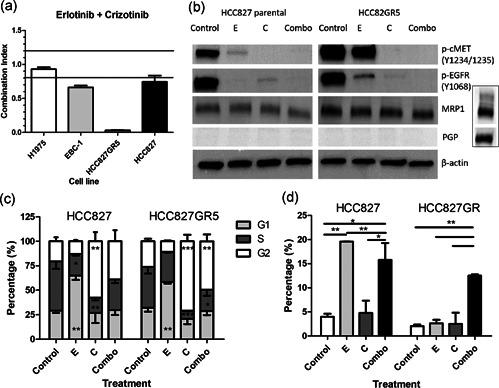
Effect of the erlotinib–crizotinib combination. This figure combines the results of different experiments, evaluating the effect of erlotinib, crizotinib or the combination of growth inhibition, protein phosphorylation, cell cycle arrest, and apoptosis. (a) Combination indexes (CIs) for erlotinib plus crizotinib after 72 hr of treatment. The upper line represents an antagonistic CI > 1.2, the lower bar represents a synergistic CI < 0.8. (b) Protein expression as determined by western blot analysis after treatment with erlotinib and crizotinib (pictures result from the same blot). The insert shows an included positive control To exclude that the lack of signal was due to lack of expression or an issue with the western blot analysis itself. (c) Cell cycle distribution was measured by flow cytometry after propidium iodide staining. (d) Apoptosis after 24 hr treatment, as assessed by the analysis of the sub‐G1 fraction. Control: 0.1% dimethyl sulfoxide, E: 10 µM erlotinib, C: 5 µM crizotinib, Combo: 10 µM erlotinib + 5 µM crizotinib. *p < .05 as compared to control, **p < .01, ***p < .001 as compared to control
