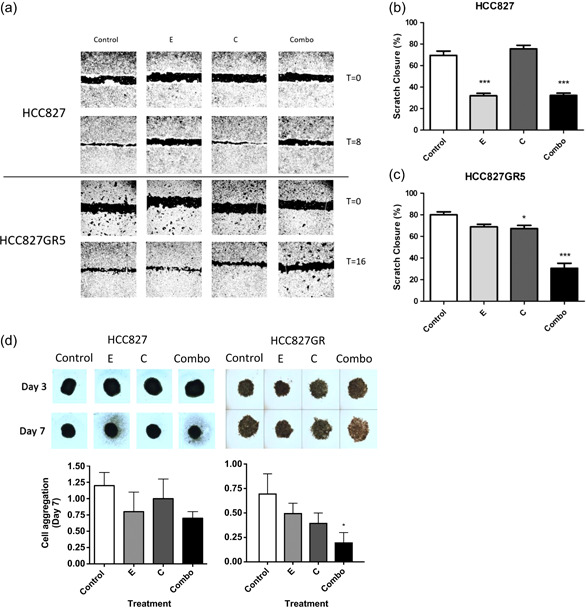
Figure 3.

Effect of the erlotinib‐crizotinib combination on cell migration and spheroids. (a) Representative images of migration assay after 0 and 8 hr for HCC827 and 0 and 16 hr for HCC827GR5. (b) Statistical evaluation of results of the wound‐healing assay on the HCC827 cell line 8 hr after scratch induction and treatment. The percentages of scratch closure for control, erlotinib, crizotinib or erlotinib + crizotinib treated cells were compared with a one‐way analysis of variance (ANOVA) in GraphPad Prism. (c) Statistical evaluation of the results of the wound‐healing assay on the HCC827GR5 cell line 16 hr after scratch induction and treatment. The percentages of scratch closure for control, erlotinib, crizotinib or erlotinib + crizotinib treated cells were compared with a one‐way ANOVA in GraphPad Prism. (d) Effect of treatment on 3D growth. Bars represent mean ± standard error of mean after 7 days of treatment of three separate tests. Day‐3 represents spheroids immediately before the start of treatment, and Day‐7 after 96 hr of treatment. Control: 0.1% dimethyl sulfoxide, E: 10 µM erlotinib, C: 5 µM crizotinib, Combo: 10 µM erlotinib + 5 µM crizotinib. *p < .05 as compared to control, ***p < .001 as compared to control
