Figure 5.

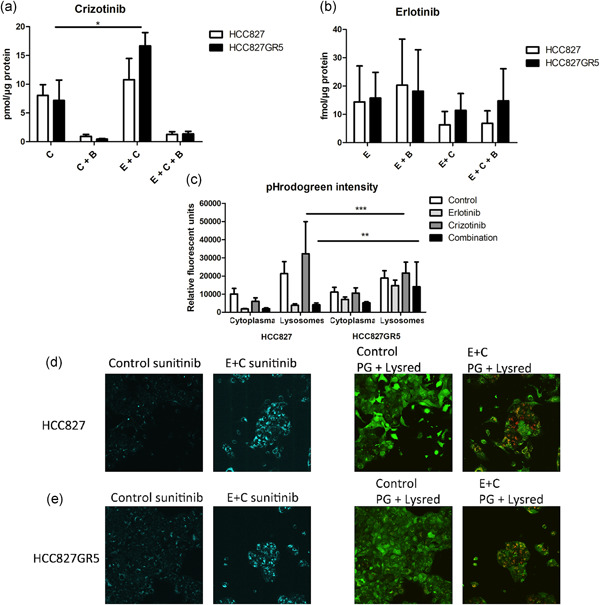
Effect of erlotinib on the intracellular and lysosomal accumulation of crizotinib and on the role of pH. Cells were treated with 0.1% dimethyl sulfoxide as control, 10 µM erlotinib, 5 µM crizotinib or their combination for 24 hr. Bafilomycin (50 nM) was used to perturb the lysosomal function. (a) Effect of erlotinib on the intracellular crizotinib concentration in pmol/µg protein. (b) Intracellular erlotinib concentration in fmol/µg protein. Bars represent mean ± standard error of mean of three separate tests. (c) Quantification of pHrodogreen intensity in relative fluorescent units with FIJI from d, e. All the p‐values are summarized in Table S1. (d, e) Intracellular effect of drugs on HCC827 and HCC827GR5, respectively, cells were stained for 1 hr with 5 µM sunitinib and 0.5 µM Lysotracker Red, and for 30 min with pHrodoGreen. Each sample was divided in multiple focus planes (z‐stack). Z‐stacks were imaged using a Leica TCS SP8 STED 3× microscope. Image panels of d from left to right: sunitinib staining of HCC827 control cells; sunitinib staining of HCC827 treated with 10 µM erlotinib and 5 µM crizotinib; Phrodogreen and Lysotracker red staining of HCC827 control cells; Phrodogreen and Lysotracker red staining of HCC827 treated with 10 µM erlotinib and 5 µM crizotinib. Image panels of e from left to right: sunitinib staining of HCC827GR5 control cells; sunitinib staining of HCC827GR5 treated with 10 µM erlotinib and 5 µM crizotinib; Phrodogreen and Lysotracker red staining of HCC827GR5 control cells; Phrodogreen and Lysotracker red staining of HCC827GR5 treated with 10 µM erlotinib and 5 µM crizotinib. Control: 0.1% DMSO, E: 10 µM erlotinib, C: 5 µM crizotinib, Combo: 10 µM erlotinib + 5 µM crizotinib, B: 50 nM Bafilomycin A1. *p < .05 as compared to control, **p < .01; ***p < .001 as compared to control
