
Figure 3.
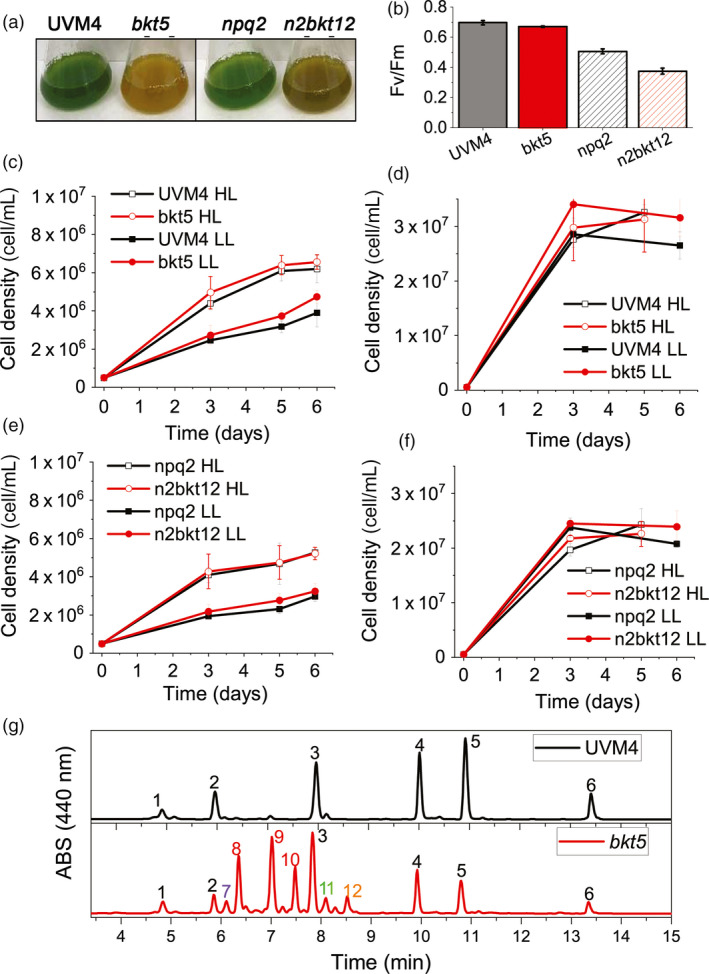
Impact of astaxanthin accumulation in Chlamydomonas reinhardtii UVM4 and npq2 backgrounds on growth (a) Cultures of UVM4, bkt5, npq2 and n2bkt12 grown in autotrophy at 100 µmol/m2/s exhibit striking differences in colour. (b) Fv/Fm of UVM4, bkt5, npq2 and n2bkt12 grown in autotrophy at 100 µmol/m2/s. (c,d) Growth curves of UVM4 and bkt5 strain in autotrophy (c, HS medium) or mixotrophy (d, TAP medium) in low light (LL, 100 µmol/m2/s) or high light (HL, 500 µmol/m2/s) conditions. (e,f) Growth curves of npq2 and n2bkt5 strain in autotrophy (e, HS medium) or mixotrophy (f, TAP medium) in low light (LL, 100 µmol/m2/s) or high light (HL, 500 µmol/m2/s) conditions. (g) Representative HPLC of pigments from UVM4 (black) and mutant bkt5 (red). 1: neoxanthin, 2: violaxanthin; 3: lutein; 4: chlorophyll b; 5: chlorophyll a; 6 β‐carotene; 7: unidentified; 8: 3S,3′S trans‐astaxanthin, 9: 3S,3′S 9‐cis‐astaxanthin, 10: 3S,3′S 13‐cis‐astaxanthin11: adonirubin, 12: canthaxanthin;. Data are expressed as mean ± standard deviation (n = 3). In panels b–f, statistically different values comparing UVM4 vs. bkt5and npq2vs. n2bkt12are indicated with *(P < 0.05).