
Fig. 1.
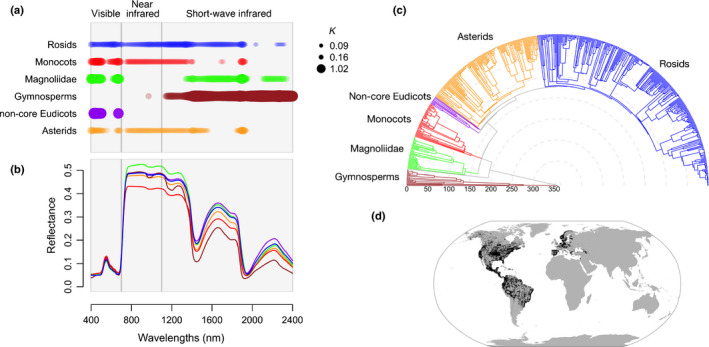
Phylogenetic signal detected in leaf spectra varies across wavelengths and across the major lineages of seed plants. (a) Phylogenetic signal calculated using Blomberg's K (K) estimated for each major lineage of seed plants separately, where regions with significant signal (P‐value < 0.05) are marked by colored circles with diameters proportional to K. (b) Mean spectra for each of the six major groups: gymnosperms (brown), Magnoliidae (green), monocots (red), non‐core eudicots (purple), asterids (orange), and rosids (blue). (c) Time‐calibrated maximum likelihood molecular phylogeny for 544 species of seed plants in the dataset. Divergence times, in millions of years, are shown on the radius axis. (d) Geographic distribution of the species sampled in the compiled dataset.