
Fig. 2.
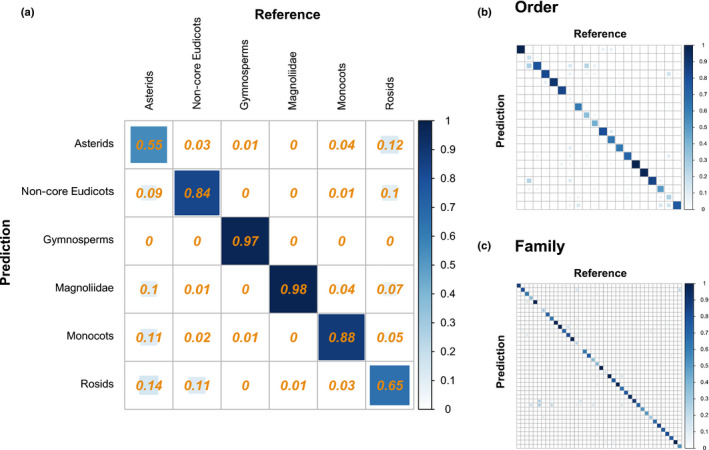
Classification matrices from PLS‐DA models for identifying (a) broad seed plant lineages, (b) orders, and (c) families using leaf spectra. Correctly identified lineages are shown on the diagonal while false positives and false negatives are shown on the off‐diagonals. The color and size of the square in each cell indicate the proportion of samples in the cell. Detailed classification matrices for orders and families are shown in Supporting Information Fig. S6.