
Fig. 4.
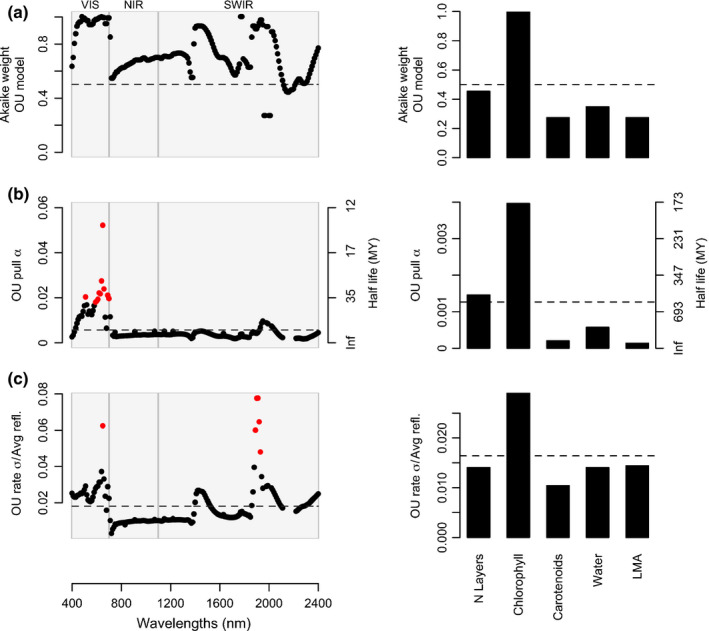
Evolution of leaf spectra and their underlying leaf attributes. (a) Akaike weights for the Ornstein–Uhlenbeck (OU) model of evolution – which incorporates evolutionary constraints – when compared to models that assume either unconstrained evolution along the phylogeny (Brownian motion) or statistical independence between traits and phylogenetic history (white noise; not shown since its Akaike weights were ≈ 0). (b, c) Model‐averaged strength of evolutionary constraints and rates of evolution across the spectrum and leaf traits. Red points denote values significantly different (z‐score > 1.96; P‐value < 0.05; two‐tailed) from the mean, shown as a dashed line. (b) Degree of evolutionary constraint α across the spectrum and for each leaf attribute. (c) Rates of evolution across spectral regions and leaf traits. Rates are square‐root transformed to be in reflectance units and scaled by the mean reflectance of each band. VIS, visible range of the spectrum; NIR, near‐infrared; SWIR, short‐wave infrared; LMA, leaf mass per area; MY, million years.