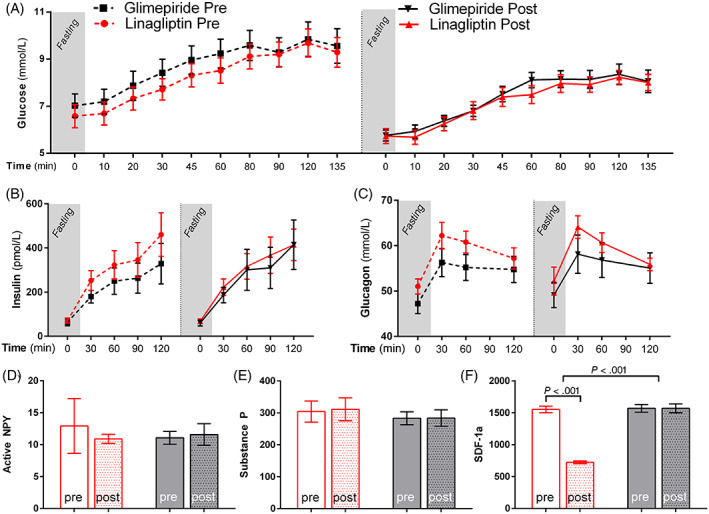
FIGURE 2.

Effects on metabolic variables. Effects of linagliptin (red line, red bars) and glimepiride (black line, black bars) on glucose, hormones and peptides; the dashed lines indicate pretreatment values: (A) glucose, (B) insulin, (C) glucagon, (D) active NPY, (E) substance‐P and (F) SDF‐1α
