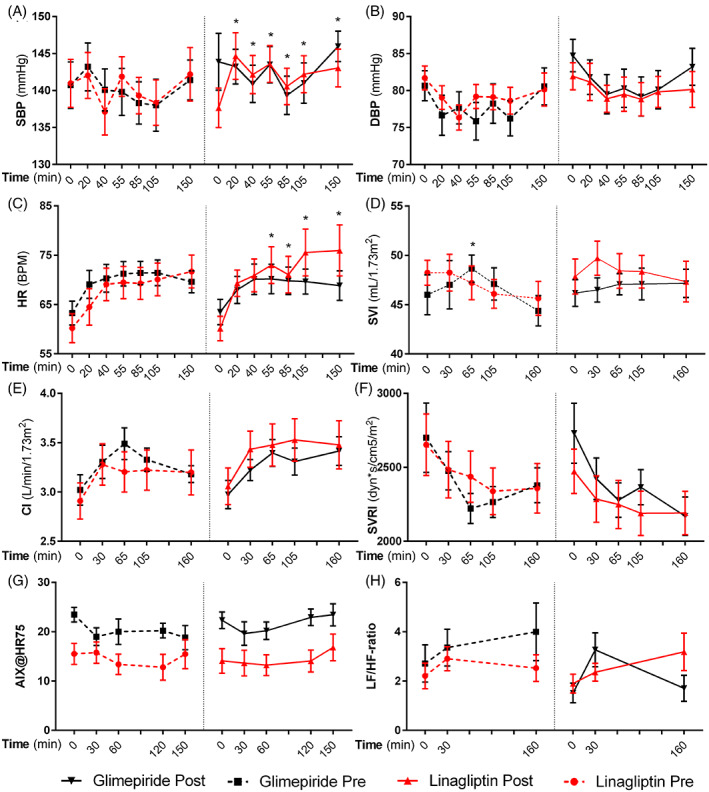
FIGURE 3.

Effects in postprandial study. Effects of linagliptin (red line) and glimepiride (black line) on postprandial haemodynamics; the dashed lines indicate pretreatment values. The liquid meal was administered immediately after time point zero: (A) systolic blood pressure; (B) diastolic blood pressure; (C) heart rate (HR); (D) stroke volume index (SVI); (E) cardiac index (CI); (F) systemic vascular resistance index (SVRI); (G) augmentation index normalized to an HR of 75 beats/minute (AIX@HR75); (H) ratio of low frequency to high frequency (LF/HF ratio); all values are expressed as mean ± SEM. Significant differences between linagliptin and glimepiride are denoted as * (P < .05), within‐group differences (before and after treatment) as # (P < .05)
