
Figure 3.
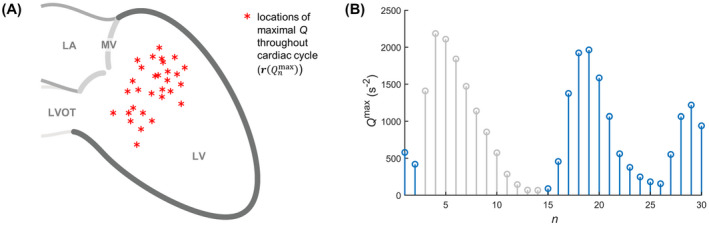
Maximum Q throughout the cardiac cycle for identification of vortex candidates. The locations of all Q maxima (A) allow calculation of a Q threshold in each frame that will reveal the strongest vortices in the LV. The maximum Q time‐curve (B) allows identification of diastolic to early systolic “vortex frames” (blue). Abbreviations: LA, left atrium; LVOT, left ventricular outflow tract