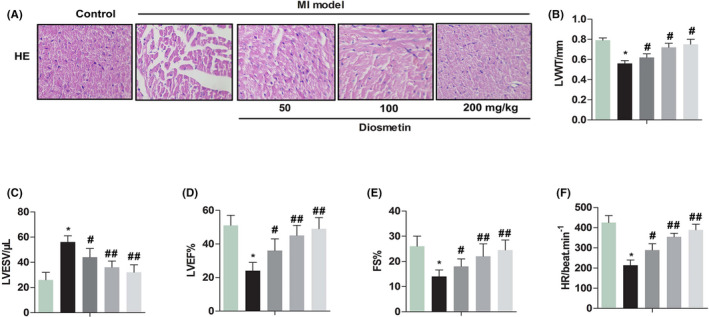
Figure 3.

Change of cardiac pathological and systolic function index after diosmetin treatment. Effect of diosmetin in sham group, MI model group, low‐dose group, medium‐dose group and high‐dose group. A, HE staining shown the cardiomyocytes were disordered, the cells were swollen, and some cells were dissolved in the MI model the neonatal rat. Magnification 200 ×. B, LVWT: left ventricular wall thickness (mm). C, LVESV: left ventricular end‐systolic volume (µL). D, LVEF: left ventricular ejection fraction (%). E, FS: fraction shortening (%). F, HR: heart rate (beat/min). The results were presented as mean ± SD and represent three individual experiments. (*P < .05 vs sham group, #P < .05 vs MI model group, ##P < .01 vs MI model group)  , Control;
  , MI model;
  , Diosmetin 50;
  , Diosmetin 100;
  , Diosmetin 200;
  , Control;
  , MI model;
  , Diosmetin 50;
  , Diosmetin 100;
  , Diosmetin 200;
  , Control;
  , MI model;
  , Diosmetin 50;
  , Diosmetin 100;
  , Diosmetin 200;
  , Control;
  , MI model;
  , Diosmetin 50;
  , Diosmetin 100;
  , Diosmetin 200;
  , Control;
  , MI model;
  , Diosmetin 50;
  , Diosmetin 100;
  , Diosmetin 200
