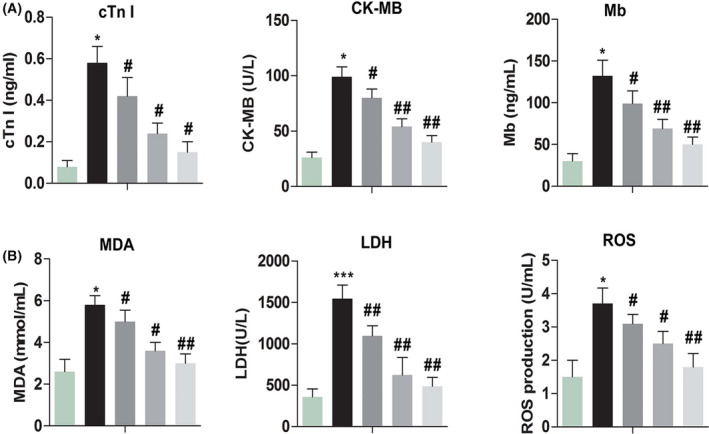
Figure 4.

Changes of myocardial index and oxidative stress index after diosmetin treatment. Effect of diosmetin in sham group, MI model group, low‐dose group, medium‐dose group and high‐dose group. A, cTnl concentration in serum was measured by enzyme‐linked immunosorbent assay (ELISA). B, CK‐MB concentration in serum was measured by ELISA. C, Mb concentration in serum was measured by ELISA. D, MDA concentration in supernatant with tissue was detected by the thiobarbituric acid chromogenic method. E, LDH concentration in serum was measured by ELISA. F, ROS production in serum was measured by ELISA. The results were presented as mean ± SD and represent three individual experiments. (*P < .05 vs sham group, #P < .05 vs MI model group, ##P < .01 vs MI model group)  , Control;
  , MI model;
  , Diosmetin 50;
  , Diosmetin 100;
  , Diosmetin 200;
  , Control;
  , MI model;
  , Diosmetin 50;
  , Diosmetin 100;
  , Diosmetin 200
