Figure 5.

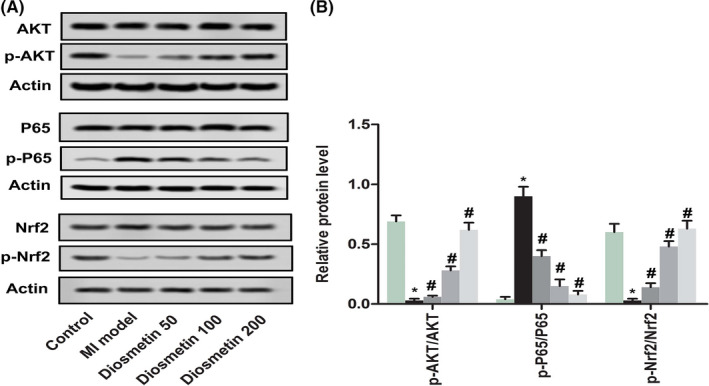
Diosmetin effect the level of AKT, P65 and Nrf2 in the MI model. A, A representative result for western blot analysis ATK, p‐ATK, P65, p‐P65, Nrf2 and p‐Nrf2 in sham group, MI model group, low‐dose group, medium‐dose group and high‐dose group. B, Semi‐quantitative analysis of the relative ratio of p‐ATK/ATK, p‐P65/P65 and p‐Nrf2/Nrf2 in each group of neonatal rats. The results were presented as mean ± SD and represent three individual experiments. (*P < .05 vs sham group, #P < .05 vs MI model group)  , Control;
  , Control;
  , MI model;
  , Diosmetin 50;
  , Diosmetin 100;
  , Diosmetin 200
