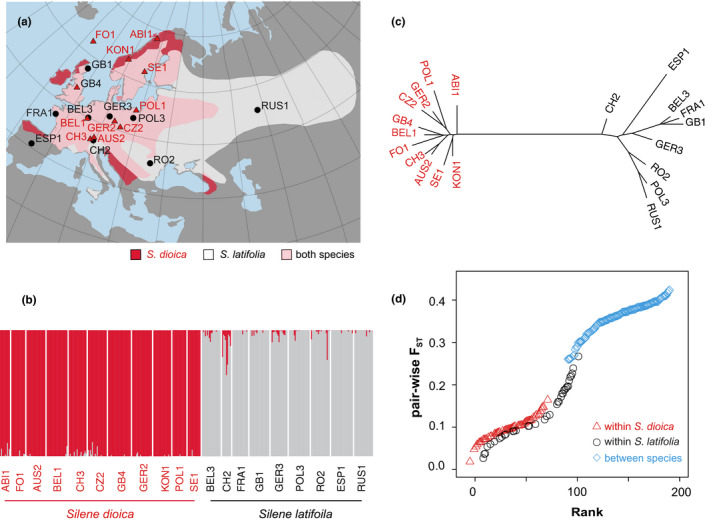
Figure 1.

(a) Geographical distribution of Silene dioica (triangles, 11 populations) and S. latifolia (circles, 9 populations, map from Karrenberg et al. (2019), used with permission); (b) bar plot of a structure analysis with K = 2, the number of species included in the study; (c) unrooted phylogenetic tree using a neighbour‐joining method based on Nei's genetic distance; (d) ranked F ST values between population pairs within S. dioica, within S. latifolia and between the two species [Colour figure can be viewed at wileyonlinelibrary.com]
