
Figure 6.
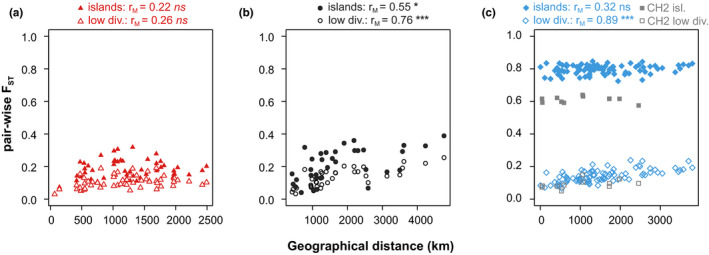
Scatterplots of pairwise differentiation (FST) against geographic distance (km) for population pairs within Silene dioica (a), within S. latifolia (b) and between the two species (c) based on contigs mapped to linkage maps. For between‐species population pairs, comparisons to the Swiss population of S. latifolia (CH2) are displayed separately (see text). Pairwise FST is given for between‐species differentiation islands (above 95% quantile of FST filled symbols) and for regions of low between‐species differentiation (below 25% quantile of FST, empty symbols). Results of Mantel tests are indicated at the top; ns , p > .05; *, p < .05; ***, p < .001 [Colour figure can be viewed at wileyonlinelibrary.com]