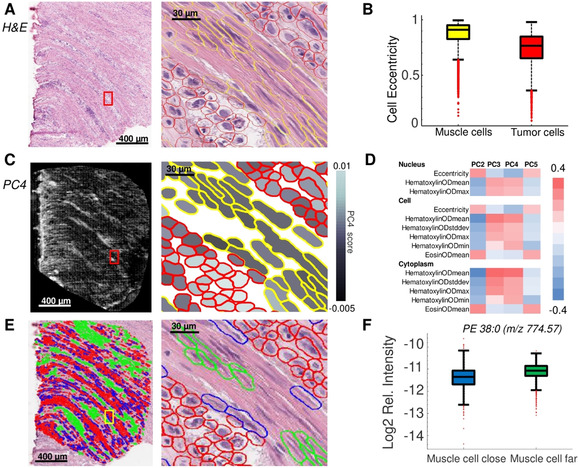
Figure 2.

Spatial statistics enabled by our method for the investigation of diffuse‐type gastric carcinoma. A) Histological images (H&E): full tissue section (left) and magnification of the highlighted region (red square) after cell detection and classification (right). B) Box‐plot shows cell eccentricity as a differential morphometric feature to discern tumor from muscle cells of the muscularis propria. C) MALDI‐MSI at 10‐μm resolution was performed and the average scores of the principal component (PC) 4 for each cell are shown (left) and overlaid with the co‐registered cell classification shown in the magnification denoted by a red square (right). D) Correlations of morphometric features with PCs from the MALDI‐MSI lipid data. E) Cell detection provides the spatial coordinates of every cell, which allows distinguishing muscle cells far away from (green) and close to (blue) tumor cells (red). Full tissue section (left), magnification of the area indicated by a yellow square (right). F) The lipid PE 38:0 (m/z 774.57±0.3 Da) exhibits a differential molecular abundance in muscle cells located close to tumor cells compared to muscle cells far away from tumor cells.
