
Figure 2.
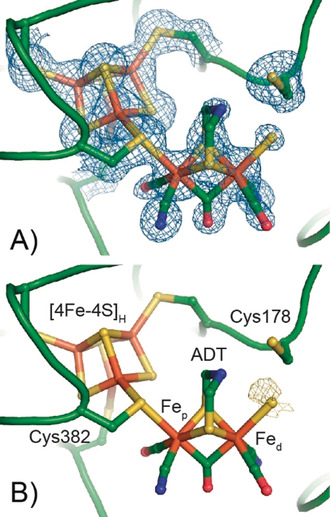
Crystal structure around the H‐cluster in the Hinact state of DdHydAB. (A) The protein backbone is presented in the cartoon representation (green), and amino acid side chains and the H‐cluster are shown in the stick representation. A 2Fo − Fc electron density map (blue mesh, contoured at 1.0 σ) is shown for Cys 178, all Cys ligating the [4Fe–4S]H sub‐cluster and the H‐cluster. An omit map generated from a model lacking the [2Fe]H sub‐site and additional S ligand is shown in Figure S2. (B) Anomalous difference map (yellow mesh, contoured at 2.0 σ) is shown for the additional ligand at the apical position on Fed.