
Figure 5.
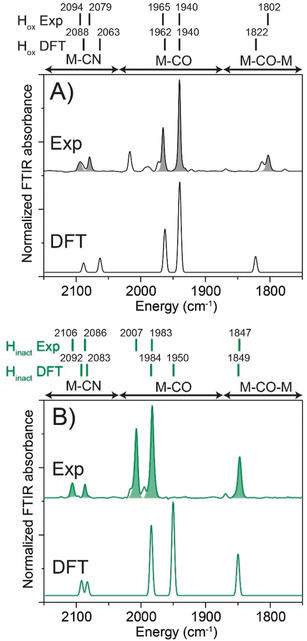
Experimental (above) and calculated (below) IR spectra of DdHydAB in (A) the Hox state and (B) the Hinact state. The experimental IR spectra were measured at 25 °C and 2 cm−1 resolution. For the calculated IR spectra, the QM/MM Hox and Hinact‐SH models were used. The experimental intensities were used in the plotted DFT spectra. Scaling factors for calculated frequencies were used (see Supporting Information).