
Figure 6.
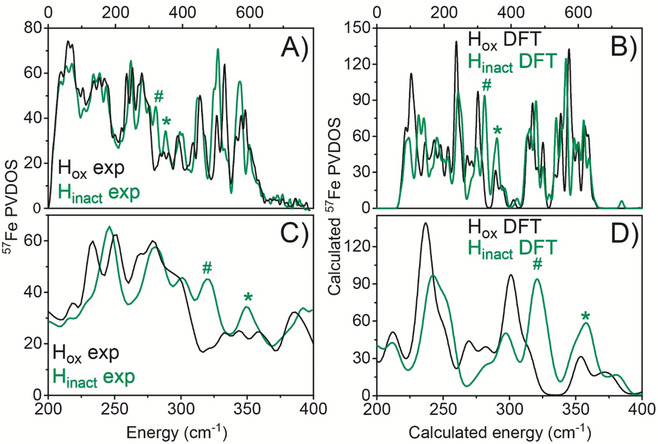
Experimental and calculated NRVS data of DdHydAB in the Hox and Hinact states. The spectra were measured on 3 mm DdHydAB samples at 40–70 K. (A) Experimental NRVS data of Hox (black trace) and Hinact (green trace). (B) Calculated NRVS data using the Hox QM/MM model (black trace) and the Hinact‐SH QM/MM model (green trace). C and D are enlargements of the Fe−S vibrational region of A and B, respectively. The asterisk indicates the peak assigned primarily to a terminal −SH group in Hinact while the hashtag indicates other Fe−S modes (associated with ADT ligand and Fep‐Cys) that shift upon oxidation.