
Figure 7.
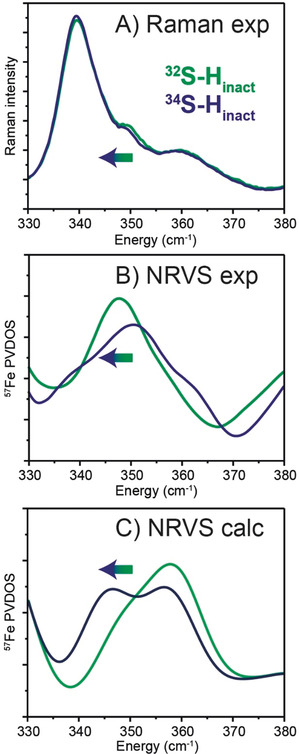
32S/34S isotope related shifts in the vibrational spectra of the Hinact state. A) Resonance Raman spectra were measured on 3 mm DdHydAB samples at 80 K using 514 nm excitation. Experimental spectra of Hinact prepared with natural abundance Na2S (green trace) and 34S‐labelled Na2S (blue) in the Fe−S region between 330 and 380 cm−1 (see Figure S25 for the full spectrum). The spectra are normalized to modes at 622 cm−1 and 644 cm−1 corresponding to the amino acid side chains phenylalanine and tyrosine, respectively.30 Experimental (B) and QM/MM‐calculated 57Fe NRVS data (C) The corresponding spectra of DdHydAB in the Hinact state with 32S (green) and 34S (blue) ligand are also displayed in the region between 330 and 380 cm−1 (see Figure S24 for the full spectra and a wider view of the Fe−S region). Calculated band positions using the Hinact‐SH QM/MM model with 32S and 34S bound at open coordination site of Fed are presented in Table S12 and shown as Movies S1 and S2.