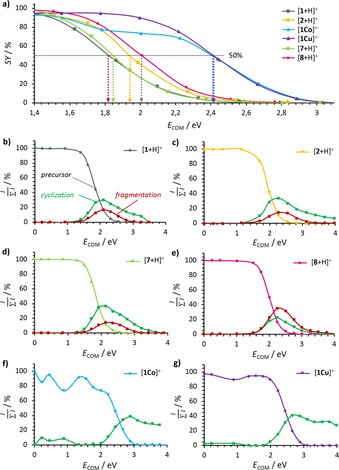
Figure 8.

Energy‐dependent CID breakdown graphs: a) Survival yield (SY) in the precursor ion region and relative intensity ratio for b) [1+H]+, c) [2+H]+, d) [7+H]+, e) [8+H]+, f) [1Co]+., and g) [1Cu]+..The precursors in b–g are depicted according to the respective color in (a), the products of cyclization steps 1–8 in green, and the side reaction of the aryl radical fragmentation in red. The x axis represents the center‐of‐mass collision energy (E COM) and the y axis the ratio of the precursor or fragment ion intensity over the sum of the intensities of all signals ( ).
