Figure 5.

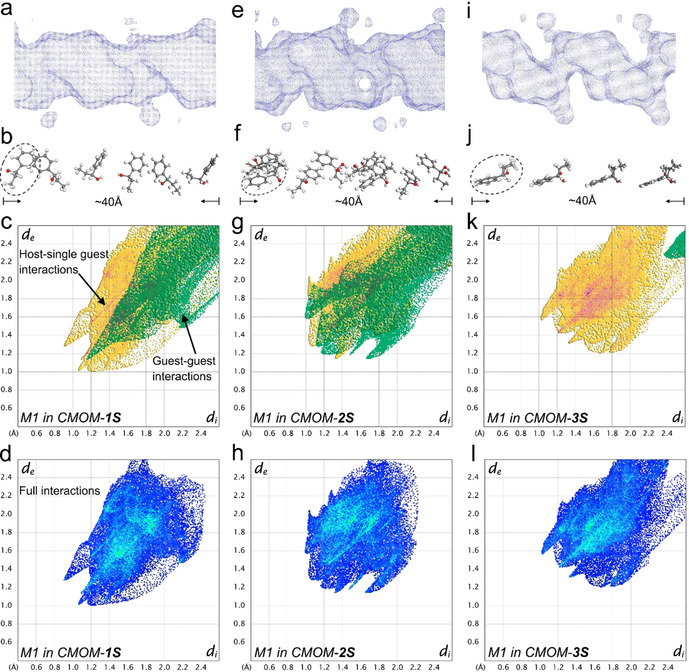
X‐ray crystallographic analysis of the guest binding of 1P1P in CMOM‐1S (left column), 2S (middle column), and 3S (right column). The shape and size of the channel of 1S (a), 2S (e), 3S (i) containing 1P1P guests is visualized as a Connolly surface generated with probe size 1.2 Å. The 1P1P guest molecules in the channel 1S (b), 2S (f), 3S (j) with distinctive orientation and alignment are shown with a length of around 40 Å. The partial (c, g, and k) and full (d, h, and l) molecular interactions of 1P1P molecule highlighted in dash circle (M1) are presented as 2D fingerprint plots. In these plots, yellow areas indicate the interactions with host framework and anions while the green area indicates the interactions with the rest of guest molecules. Blue color was used in full interaction maps. The intense and highlight area (red and cyan color) represents the greatest contribution to surface.
