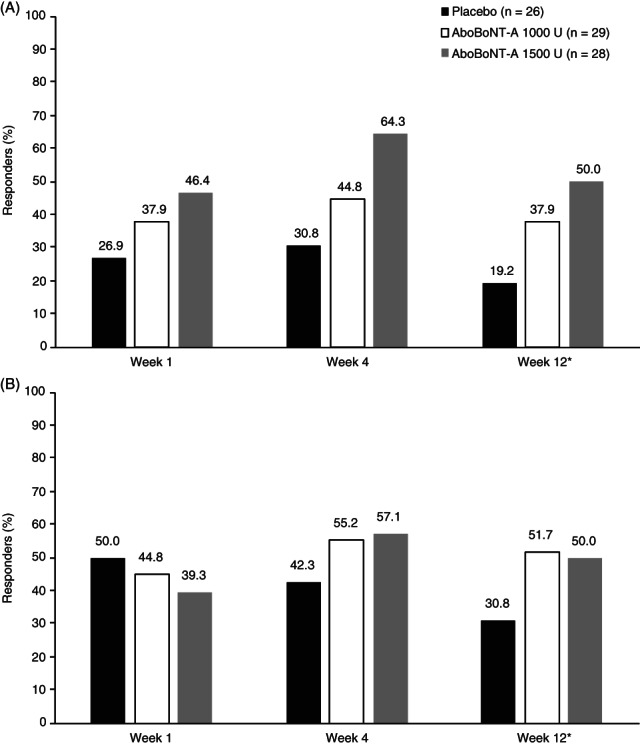
Figure 2.

Proportion of responders (≥1 grade improvement) to aboBoNT‐A based on MAS score for (A) GSC muscle tone and (B) soleus muscle tone. AboBoNT‐A, abobotulinumtoxinA; GSC, gastrocnemius‐soleus complex; MAS, Modified Ashworth Scale. *At week 12, n = 1 missing in placebo and aboBoNT‐A 1000 U groups, n = 2 missing in aboBoNT‐A 1500 U group. Data are presented for the intention‐to‐treat population. Responders were defined as patients with at least a one grade improvement in muscle tone (score on the MAS) in comparison to baseline.
