
Figure 1.
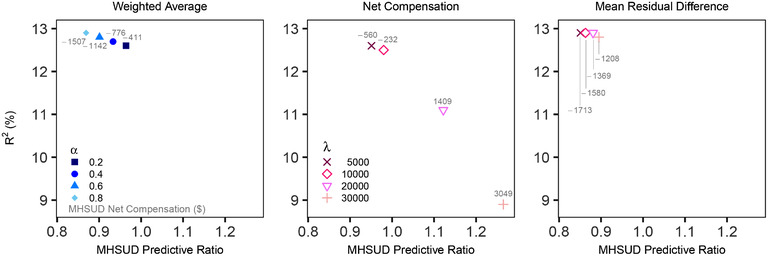
Global fit versus group fairness
Note: Variation in cross‐validated performance by hyperparameter is plotted for three estimators. Predictive ratios for mental health and substance use disorders (MHSUD) are contrasted with overall R 2 fit. Results for all hyperparameters in the covariance constrained regression, , were extremely similar and thus omitted.