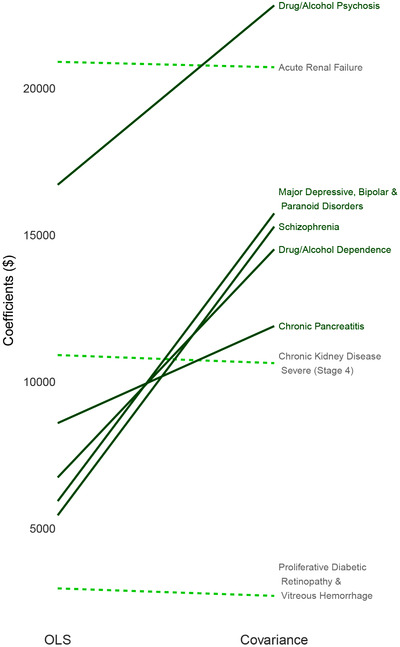
Figure 2.

Largest coefficient changes
Note: Increases in coefficient values from the OLS to covariance constrained regression are represented by solid lines with decreases in dashed lines. Largest five increases and largest five decreases were considered; “Chronic kidney disease, severe (Stage 4)” and “Severe hematological disorders” (both decreases) were suppressed due to large magnitudes while having small relative percentage changes of <1%.
