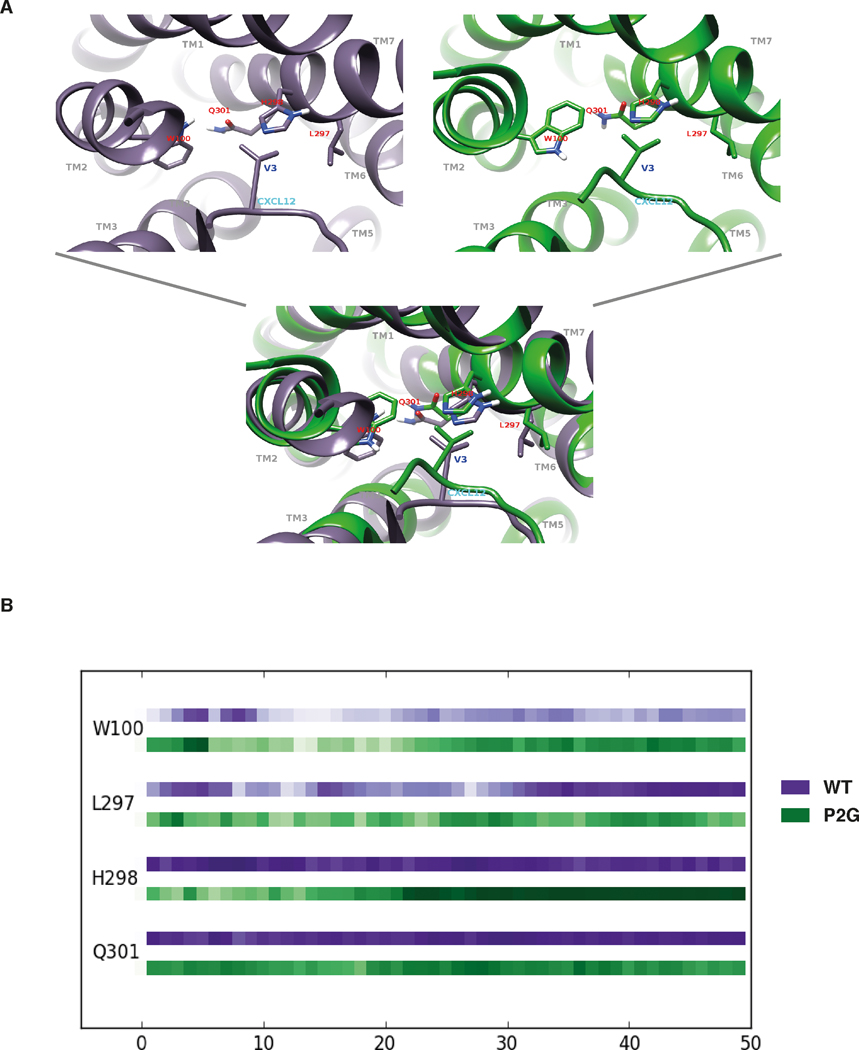
FIGURE 6. MD simulations of ACKR3-CXCL12 complexes revealed a critical role for the V3 N-terminal residue of CXCL12.
(A) Views of the interaction sites established between ACKR3 residues (marked in red) and the V3 residue of either the WT CXCL12 (left panel) or the P2G variant (right panel). Bottom panel represents a superposition of both tertiary structures. (B) Plots of the interaction strength between the V3 residue of either CXCL12 (purple line) or the P2G variant (green line) and ACKR3 residues as a function of time. ACKR3 residues are listed on the left side of the chronogram and the horizontal axis corresponds to the time of simulation in ns. Interaction strength is represented as a function of color intensity (darker color indicates stronger interaction).

