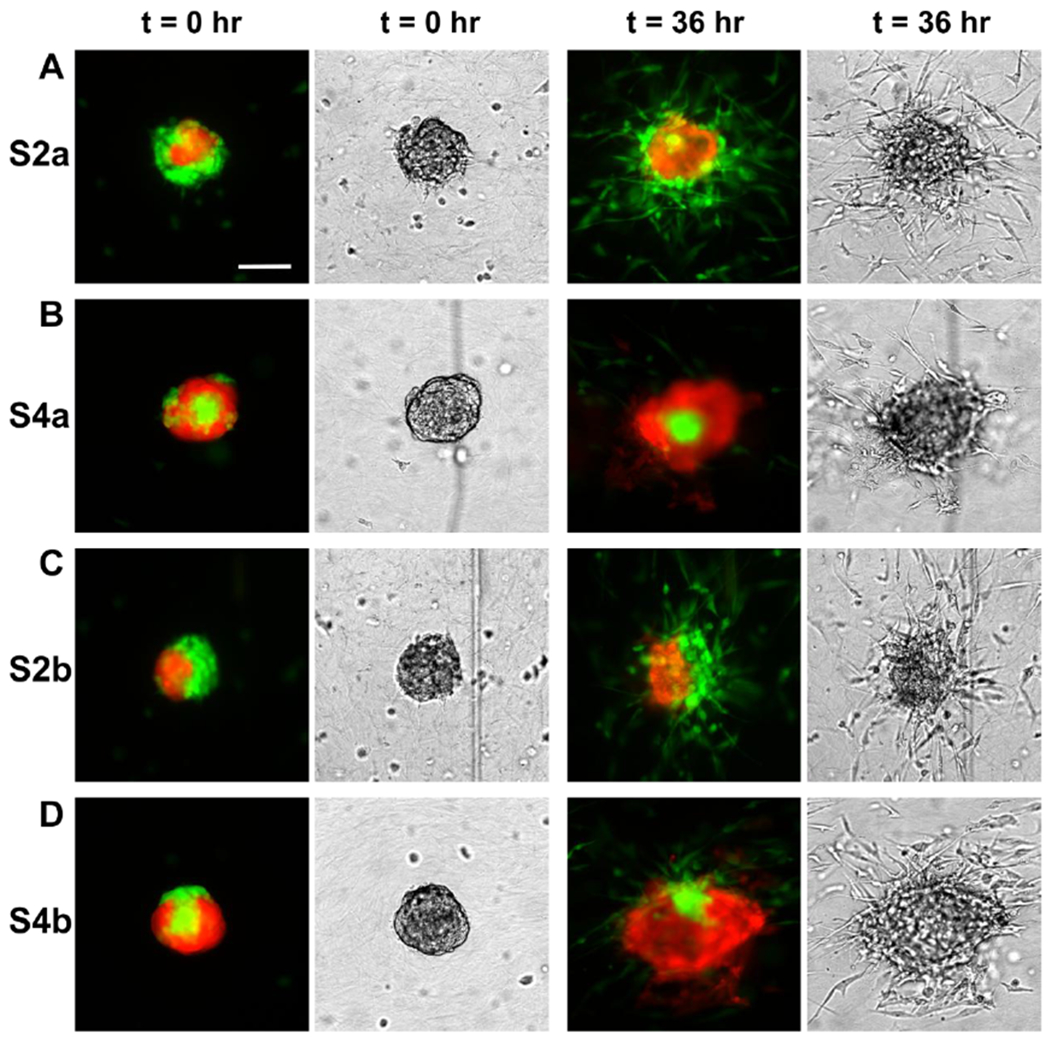
Figure 2: Architecture of the co-culture spheroids regulated tumor invasion in 3D collagen matrices.

Fluorescence (left) and brightfield (right) images of tumor spheroids at time points t = 0 and 36 hrs. A. In the spheroids with MDA-MB-231 cells outside of a MCF-10A cluster (S2a), significant numbers of the MDA-MB-231 cells invaded out of the spheroid. B. In the spheroids with MCF-10A cells outside of MDA-MB-231 cell cluster (S4a), only the peripheral MDA-MB-231 cells invaded out of the spheroid while the majority malignant MDA-MB-231 cells enclosed within the MCF-10A cells remained inside. C. In the spheroids with two cell types side by side (S2b), significant numbers of MDA-MB-231 cells invaded out of the spheroid from one side of the spheroid. D. In the spheroids with MCF-10A surrounding MDA-MB-231 cells with an opening (S4b), MDA-MB-231 cells invaded out through the opening. The collagen concentration is 1.5 mg/mL. Images were captured from the middle Z plane of the spheroids. Scale bar: 100 μm. The scale bar is the same for Fig. A,B,C,and D.
