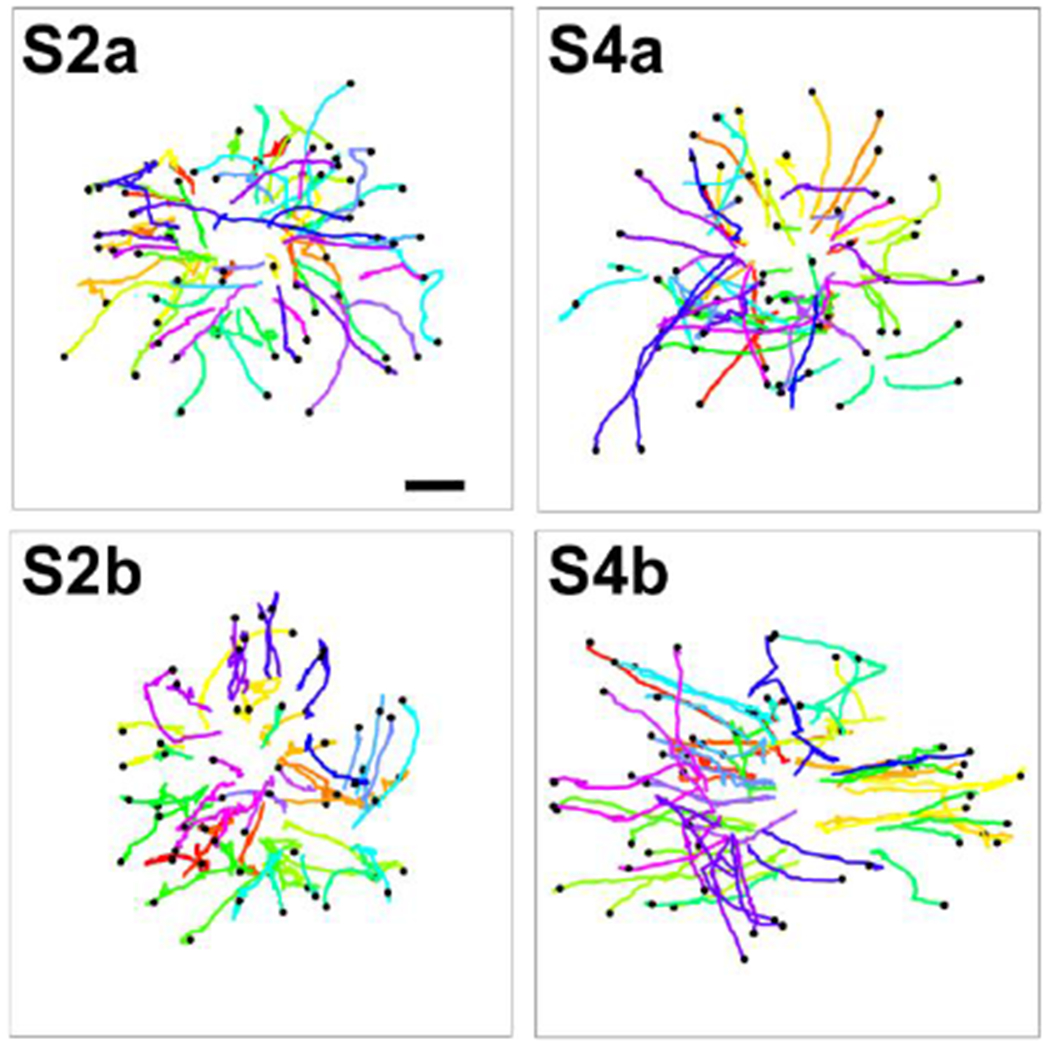
Figure 4: Trajectories of MDA-MB-231 cells invading out of the tumor spheroids.

60 tumor cell trajectories were presented for each spheroid architecture. Each colored line represents one cell trajectory. The start point of each trajectory was at the x and y coordinate for the cell position when it started to migrate away from the spheroid, and the end point is presented as a black dot. The time durations of the trajectories range from 14 to 36 hours (average of 28 hours) for S2a, 10 to 36 hours (average of 29 hours) for S4a, 12 to 36 hours (average of 29 hours) for S2b and 6 to 36 hours (average of 23 hours) for S4b. Scale bar: 100 μm. The scale bar is the same for the four trajectory plots.
