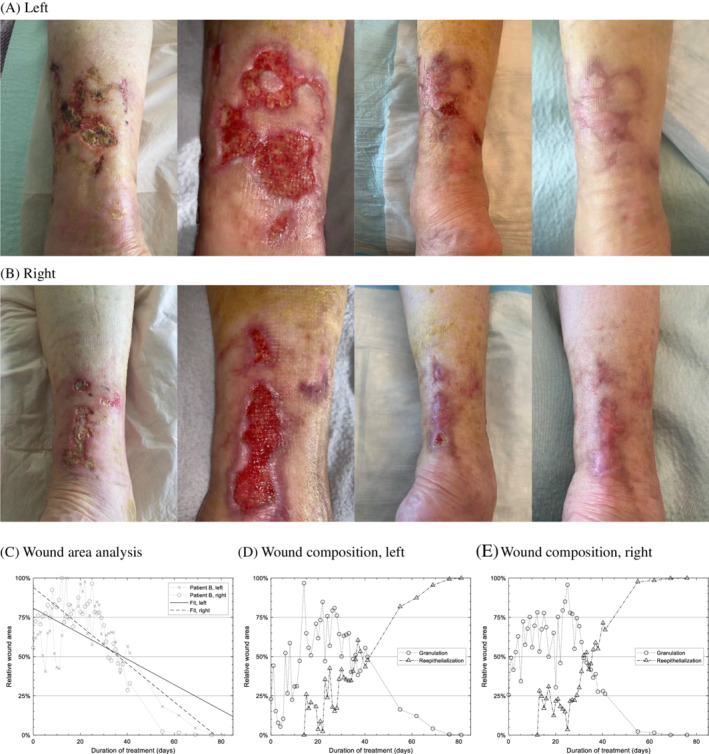
FIGURE 2.

Patient B: A,B, Representative images of the wound region of (A) Patient A's left leg on day 0, 27, 55, and 81 (2 days after closure), and (B) Patient A's right leg on day 0, 27, 55, and 76. C, Result of tracking of wound area through duration of treatment for both legs. The wound was seen completely closed on day 79 and 76, respectively. When fitted to a linear regression model, the expected wound closure dates are 100 and 77 days, respectively. D,E, Result of wound composition analysis showing the relative area of granulated tissue vs reepithelialized tissue for the two legs
