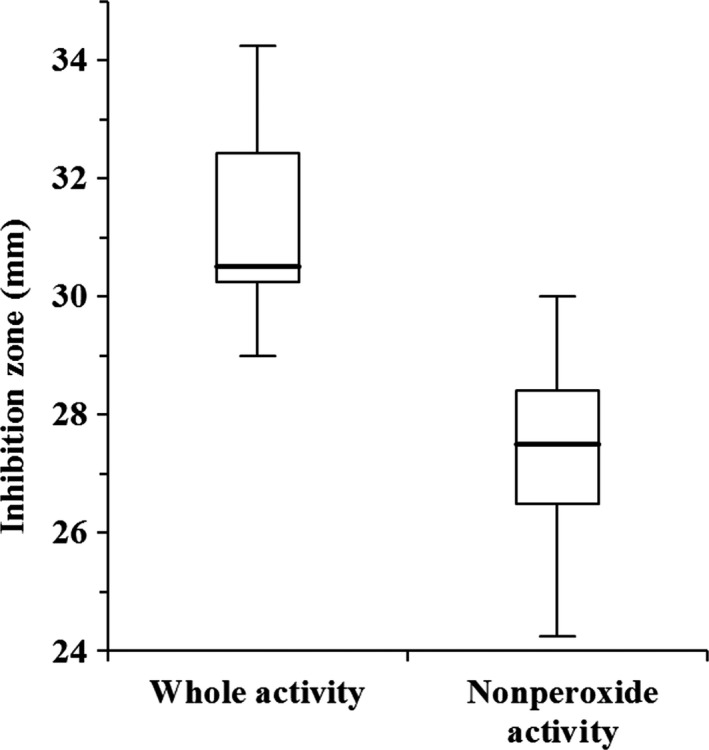
Figure 2.

Box plot diagram of antibacterial activity. The horizontal line represents the median, the box shows the 25th and 75th percentiles, and the whiskers represent the 5th and 95th percentiles. The two bioassays were significantly different for P < 0.05 (Kruskal–Wallis test).
