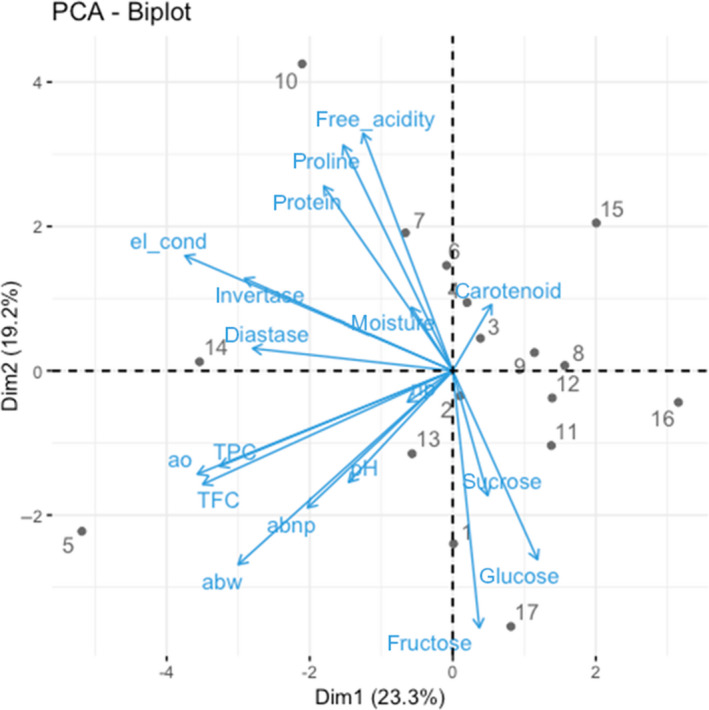
Figure 3.

Biplot of the first two components obtained by PCA performed with data obtained from all assayed parameters. Arrows indicate the eigenvectors for assayed parameters, and dots represent honey samples (1–4 = Kakamega, 5–8 = Coast, 9–12 = Mwingi, 13–16 Mt. Kenya, 17 = Manuka5+). abnp, antibacterial (nonperoxide activity); abw, antibacterial (whole activity); ao, antioxidant (1/IC50); el_cond, electrical conductivity; nb, H2O2 contribution; TFC, total flavonoid content; TPC, total phenolic content. [Colour figure can be viewed at wileyonlinelibrary.com]
