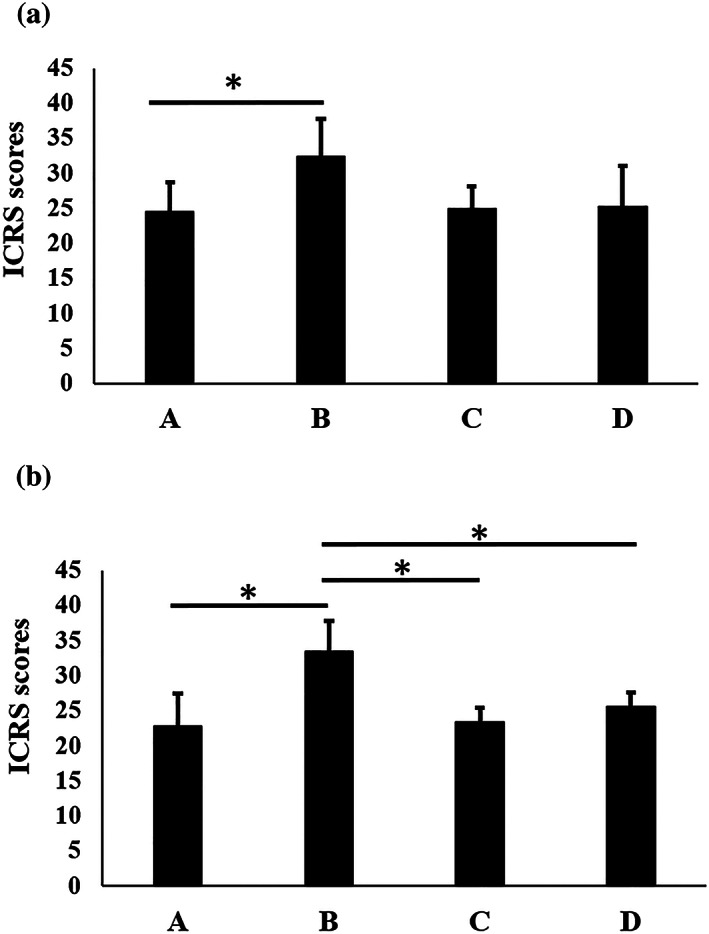
FIGURE 4.

Histological evaluation of repaired tissue at (a) 4 weeks and (b) 12 weeks after transplantation. Group A, untreated; Group B, LC sheet containing 5.0 × 10⁵ cells alone; Group C, SY sheet containing 5.0 × 10⁵ cells alone; and Group D, SY sheet plus LC sheet, each containing 5.0 × 10⁵ cells. For each group, n = 6. At 4 weeks after transplantation, the scores for Groups A, B, C, and D were 24.6 ± 4.1, 32.3 ± 5.4, 24.9 ± 3.2, and 25.2 ± 5.9, respectively. ICRS scores in Group B were significantly higher than those in Group A (p < 0.05). At 12 weeks after transplantation, the scores for Groups A, B, C, and D were 22.8 ± 4.6, 33.5 ± 4.4, 23.3 ± 2.1, and 25.5 ± 2.1, respectively. ICRS scores in Group B were significantly higher than those in Groups A, C, and D (p < 0.05). The results are presented as mean ± standard deviation. LC: layered chondrocyte; SY: synoviocyte; ICRS: International Cartilage Regeneration and Joint Preservation Society
