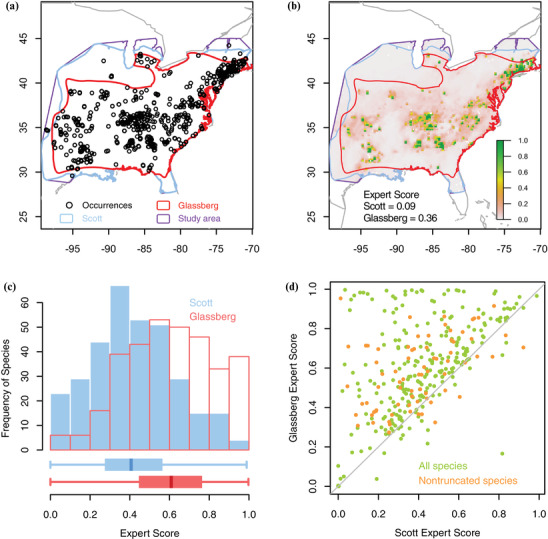
Figure 1.

Butterfly distributional data and expert score (Eq. 4) reflecting the performance of 2 sources of experts’ range maps compared with the (continuous) probability of occupancy, (value close to 1, strong agreement between expert range and species distribution modeling predictions; value close to 0, no ability to differentiate suitable landscape from unsuitable). For Achalarus lyciades (a) expert range maps from Scott and Glassberg and occurrence records from North American Butterfly Association, Butterflies and Moths of North America, and Global Biodiversity Information Facility and (b) predicted habitat suitability based on species distribution models relative to expert maps (legend shows habitat suitability range) (1, high quality habitat). (c) Scott and Glassberg expert scores for 330 species in the study. (d) Glassberg expert score relative to Scott expert score for all 330 species.
