Figure 1.

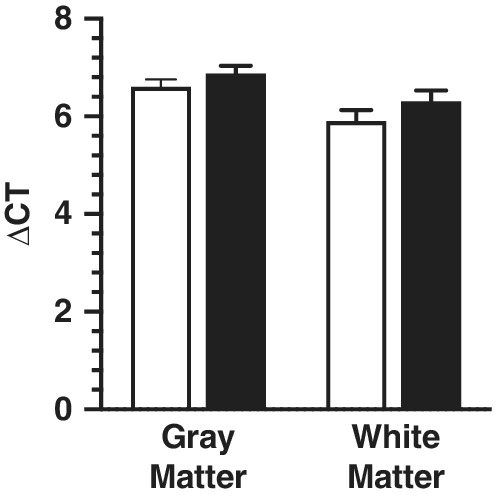
Difference between the Ct values of the two reference genes TBP and GAPDH in both gray (n = 17) and white matter (n = 14) using quantitative real‐time PCR. No significant differences were identified for either group in both brain areas.

Difference between the Ct values of the two reference genes TBP and GAPDH in both gray (n = 17) and white matter (n = 14) using quantitative real‐time PCR. No significant differences were identified for either group in both brain areas.