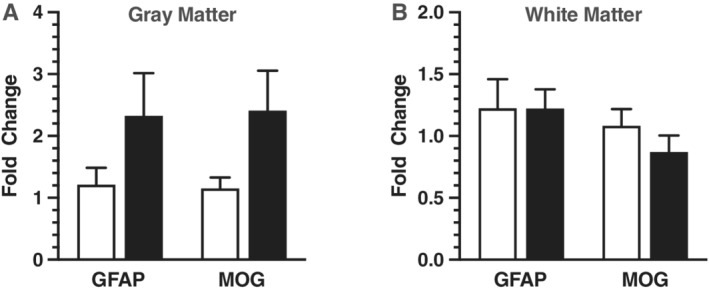
Figure 2.

Panel A is real‐time quantitative PCR analysis of MOG (n = 13) and GFAP (n = 12) in gray matter using punch‐dissected anterior cingulate tissue centered at layer III from age‐matched pairs of male donor tissue from typically developing controls (unfilled bars) and males diagnosed with ASD (filled bars). Target gene expression was normalized to the geometric mean of TBP and GAPDH. Relative gene expression levels that were significant or close to significant are shown as fold changes using the Livak and Schmittgen method [Livak & Schmittgen, 2001]. Panel B is MOG (n = 10) and GFAP (n = 10) in white matter donor pairs.
