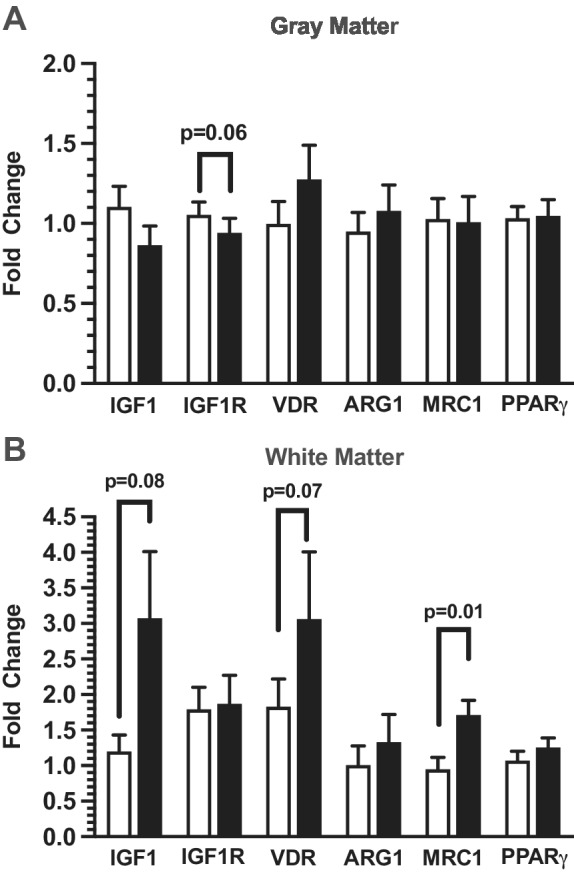
Figure 4.

Real‐time polymerase chain analysis of anti‐inflammatory related genes IGF1 (n = 15), IGF1R (n = 14), VDR (n = 13), ARG1 (n = 12), MRC1 (n = 10), and PPARγ (n = 13) in ACC cortical gray matter punch‐dissected using layer three as the diameter in typically developing (TD) males (unfilled bars) and ASD donor tissue (filled bars) is shown in panel A. Panel B represents anti‐inflammatory related genes IGF1 (n = 13), IGF1R (n = 11), VDR (n = 11), ARG1 (n = 8), MRC1 (n = 12), and PPARγ (n = 10) in ACC superficial white matter. Relative gene expression was normalized to the geometric mean of TBP and GAPDH and shown as fold changes using the Livak and Schmittgen method [Livak & Schmittgen, 2001].
