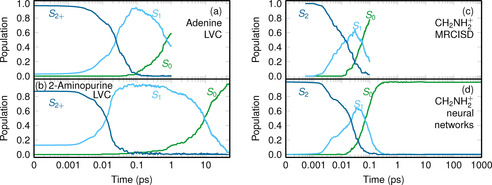
Figure 7.

Examples of the temporal evolution of electronic population obtained from non‐adiabatic dynamics simulations over long time scales (note the logarithmic scale) using fitted potential energy surfaces. a,b) Comparison of the dynamics of adenine and 2‐aminopurine, two structural isomers with quite different photophysics:220 Whereas adenine deactivates to the ground state with a time constant of 1 ps, 2‐aminopurine takes about 13 ps. Both simulations were run with linear vibronic coupling potentials. Adapted from Ref. 213 with permission. c,d) Comparison of the dynamics of the methylenimmonium cation CH2NH2 +.221 The expensive MRCISD method in (c) was used only to simulate 100 fs, whereas in (d) a neural network was used to fit the MRCISD PESs and enabled a total simulation time of 1 ns.216 Adapted from Ref. 216 with permission.
